Quant Research at Machine Speed. 24/7.
AI agents automate a proven investment process. 200K strategies tested. Evolving 24/7.
Learn MoreThe Thesis
Markets are entering uncharted territory. Volatility is structural, not cyclical. Traditional quant models — built on decades of stable assumptions — are breaking down under regime shifts that arrive faster than any human team can adapt.
At the same time, AI is crossing a threshold. Not incremental improvement — a step change in what machines can reason about, test, and execute autonomously.
“I think we have achieved AGI.”
Huang defines AGI as AI capable of starting and running a billion-dollar company — precisely the kind of autonomous operation DeltaBlock is built on.
We built DeltaBlock to sit at this intersection: a fund where autonomous AI agents design, test, and refine trading strategies at a speed and depth no human team could match — guided by decades of institutional trading experience.
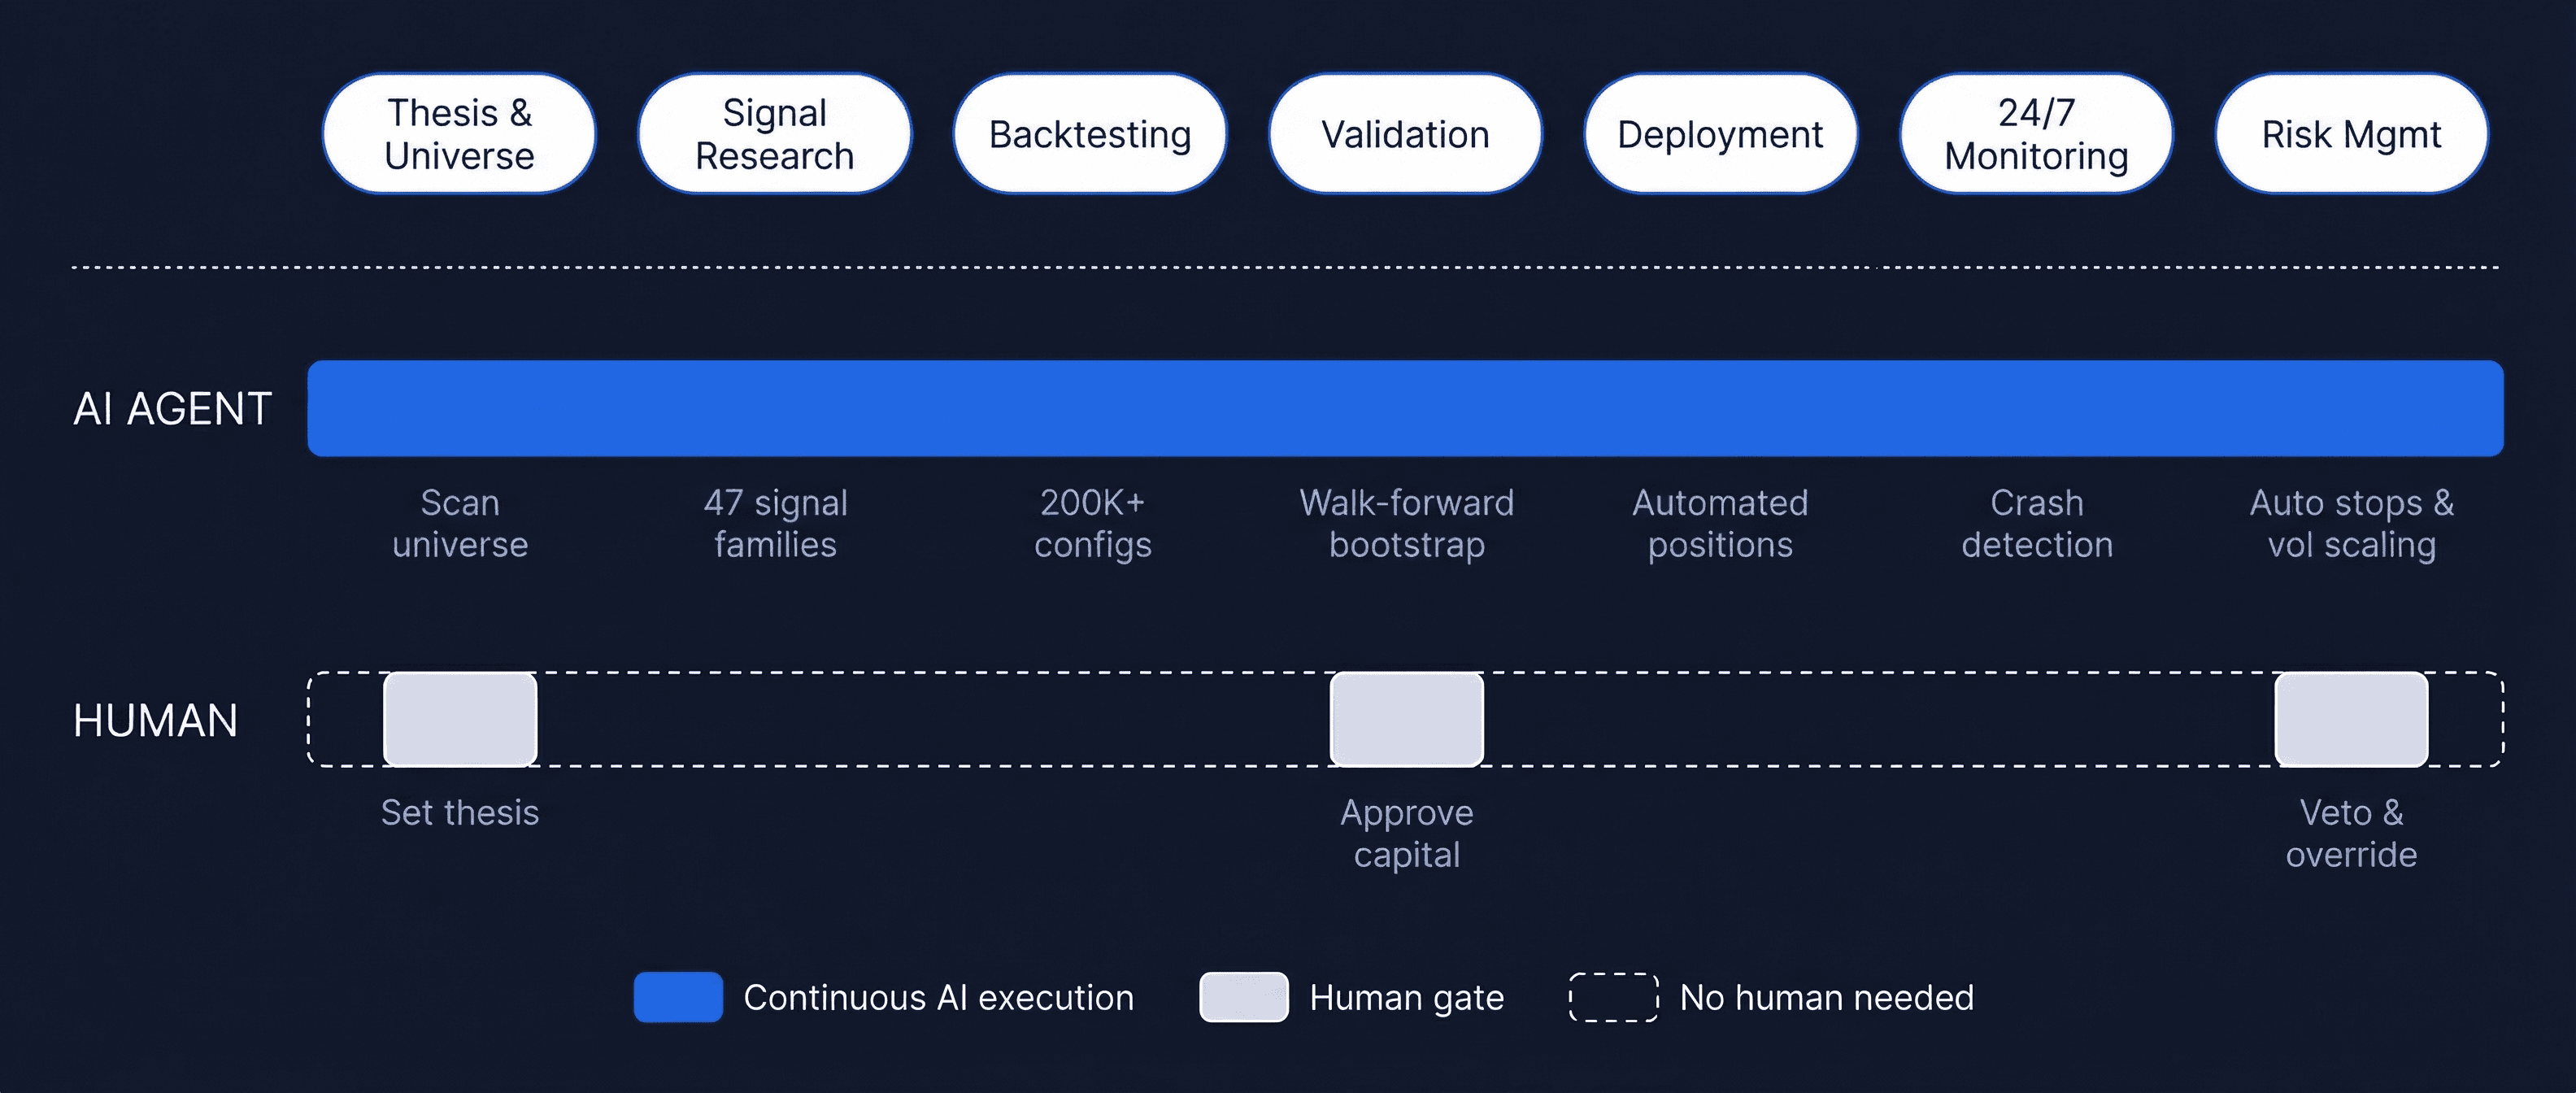
Agentic Quant: A Proven Process, Automated
The investment process is quantitative — rigorous, rules-based, and battle-tested. We did not reinvent the process. We automated who performs it.
Why Agentic Quant, Not AI-Driven Investing?
Quantitative investing is a mature, proven discipline. We automated who performs it — not what is performed.
- ✕Not LLM-driven stock picking or fundamental analysis — no AI "intuition" driving trades.
- ✕Not AI making judgment calls on markets — every signal is mathematical, not conversational.
- ✕Not replacing human investment oversight — critical decisions require human approval.
- ✓Systematic, rules-based quant strategies — researched, tested, and executed by AI agents.
- ✓Every signal is backtested across market regimes, validated by bootstrap and walk-forward analysis.
- ✓Human oversight at every critical gate — thesis definition, capital approval, and risk veto.
How We're Different
Speed
197,000+
configurations tested in weeks
Our AI agents exhaustively search the strategy space — testing more configurations in weeks than a traditional quant team tests in years.
Depth
47
signal families across macro, momentum, volatility, arbitrage
Spanning macro indicators, momentum signals, volatility surfaces, and arbitrage structures — each rigorously validated across multiple market regimes.
Width
24/7
autonomous operation across global markets
Continuous, autonomous operation across global crypto and macro markets — no sleep, no gaps, no missed opportunities.
Meaningful Diversification
Diversification only works if it's meaningful.
Owning seven tech stocks is not diversification. Running five momentum strategies on the same asset is not diversification. True diversification means strategies that genuinely don't move together.
0.10
Average Strategy Correlation
0.30–0.50
Typical Industry Range
Near-zero correlation means our strategies are effectively independent — when one loses, others don't follow.
We diversify across four independent axes:
Strategy Type — momentum, volatility, carry, arbitrage
Asset Class — equities, commodities and digital assets
Time Horizon — intraday to multi-week
Geography — global 24/7 coverage
Disciplined Leverage
Conservative leverage deployment with conviction-based scaling — only using leverage when signals are strongest.
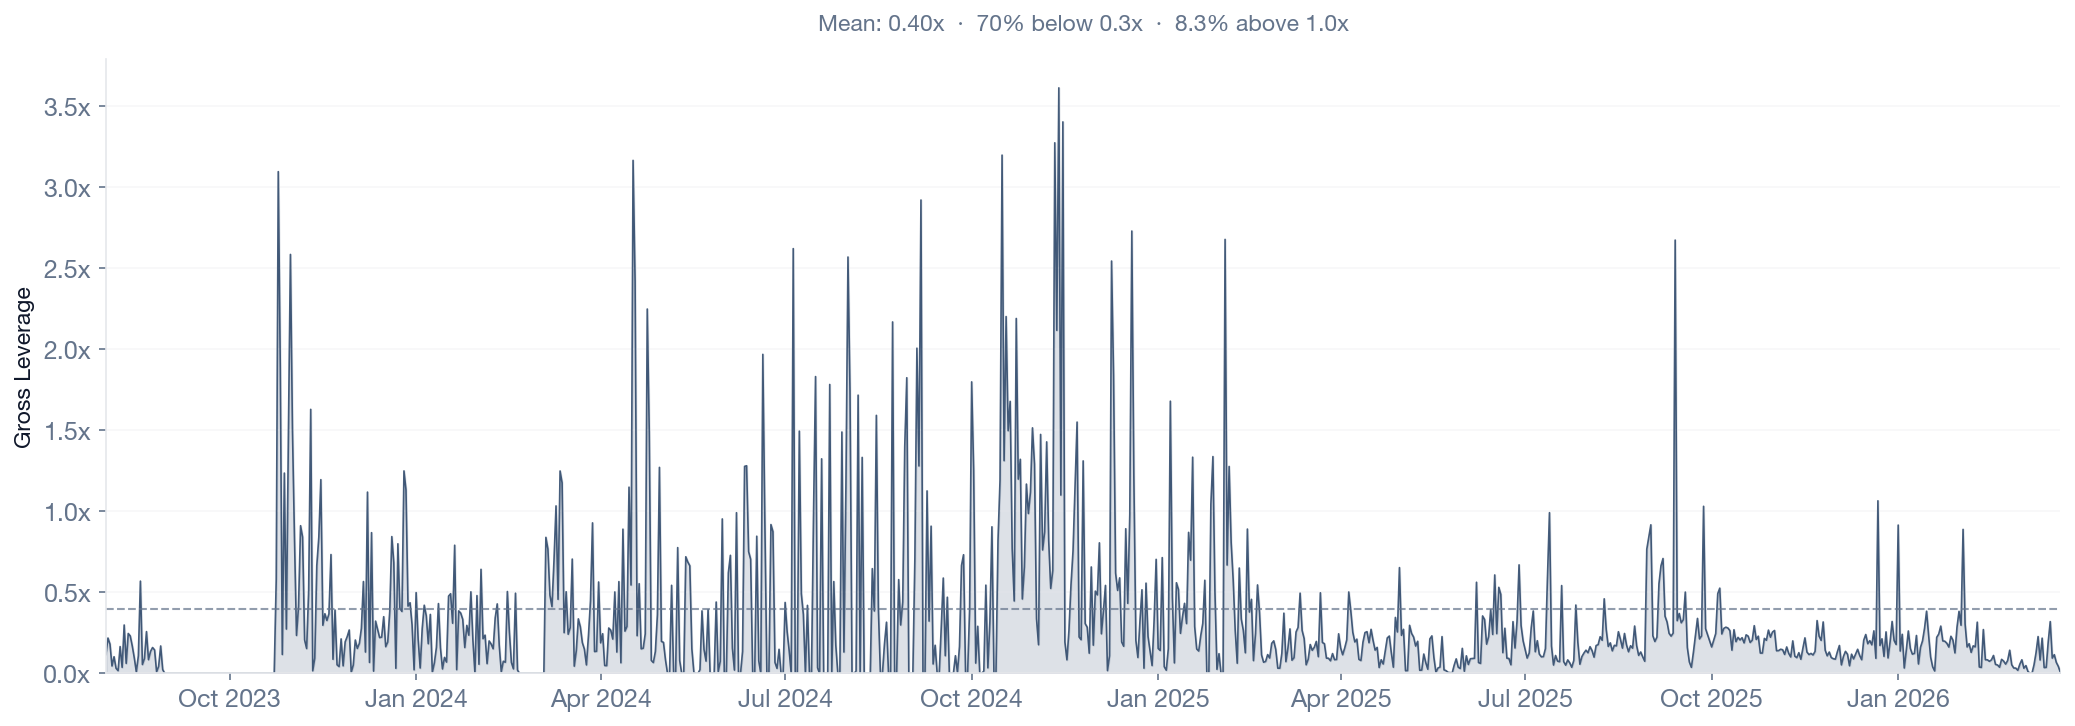
Leverage data from canonical backtest (Aug 2023 – Mar 2026). Effective gross leverage includes vol-target scaling across all strategies.
0.40x
Mean Leverage
70%
Days Below 0.3x
8.3%
Days Above 1.0x
Our system deploys leverage with discipline. The mean leverage of 0.40x reflects a conservative baseline — the fund operates well below its maximum capacity most of the time. Leverage scales up only when multiple independent signals align with high conviction, and is rapidly reduced when uncertainty rises.
With 70% of days running below 0.3x leverage and only 8.3% above 1.0x, capital is preserved during uncertain periods and deployed aggressively only when the edge is clearest.
Performance Across All Regimes
Conviction-gated leverage and genuine multi-strategy diversification produce consistent returns — regardless of market direction.
Bull Markets
BTC rising >10% monthly
+8.4%
Avg. Monthly Return
Momentum and macro strategies capture directional trends. Leverage scales up as multiple signals align with high conviction. Portfolio outperforms BTC in 80% of bull months.
Bear Markets
BTC falling >10% monthly
+7.0%
Avg. Monthly Return
Short signals, volatility premium capture, and funding arbitrage generate positive returns while BTC declines. Portfolio has beaten BTC in every single bear month — 100% win rate.
Choppy / Range-Bound
BTC within +/-10% monthly
+4.3%
Avg. Monthly Return
Cross-sectional momentum and arbitrage strategies thrive in high-dispersion environments. When BTC chops sideways, our diversified approach still extracts edge from volatility.
Win rate is measured as months where the portfolio outperforms BTC. This all-weather profile emerges from 14 genuinely independent strategies, each designed for different market conditions, combined through conviction-gated leverage that scales exposure only when the edge is clearest.
Performance
461%
Cumulative Return
-2.4%
Max Drawdown
Aug 2023 – Mar 2026
Backtest Period
Year-by-Year Consistency
| Year | Return | Sharpe Ratio | Max Drawdown |
|---|---|---|---|
| 2023 (Aug-Dec) | +51.3% | 4.48 | -1.9% |
| 2024 | +199.6% | 8.14 | -1.7% |
| 2025 | +75.0% | 5.40 | -1.6% |
| 2026 (YTD) | +8.8% | 4.96 | -0.7% |
This website is provided for informational purposes only and does not constitute investment advice, an offer to sell, or a solicitation of an offer to buy any securities or financial instruments.
Past performance is not indicative of future results. Based on backtest results from Aug 2023 to Mar 2026 across 14 strategies. Not audited.
Return Stability
Tight distribution with controlled tails — consistent daily returns across all market conditions.
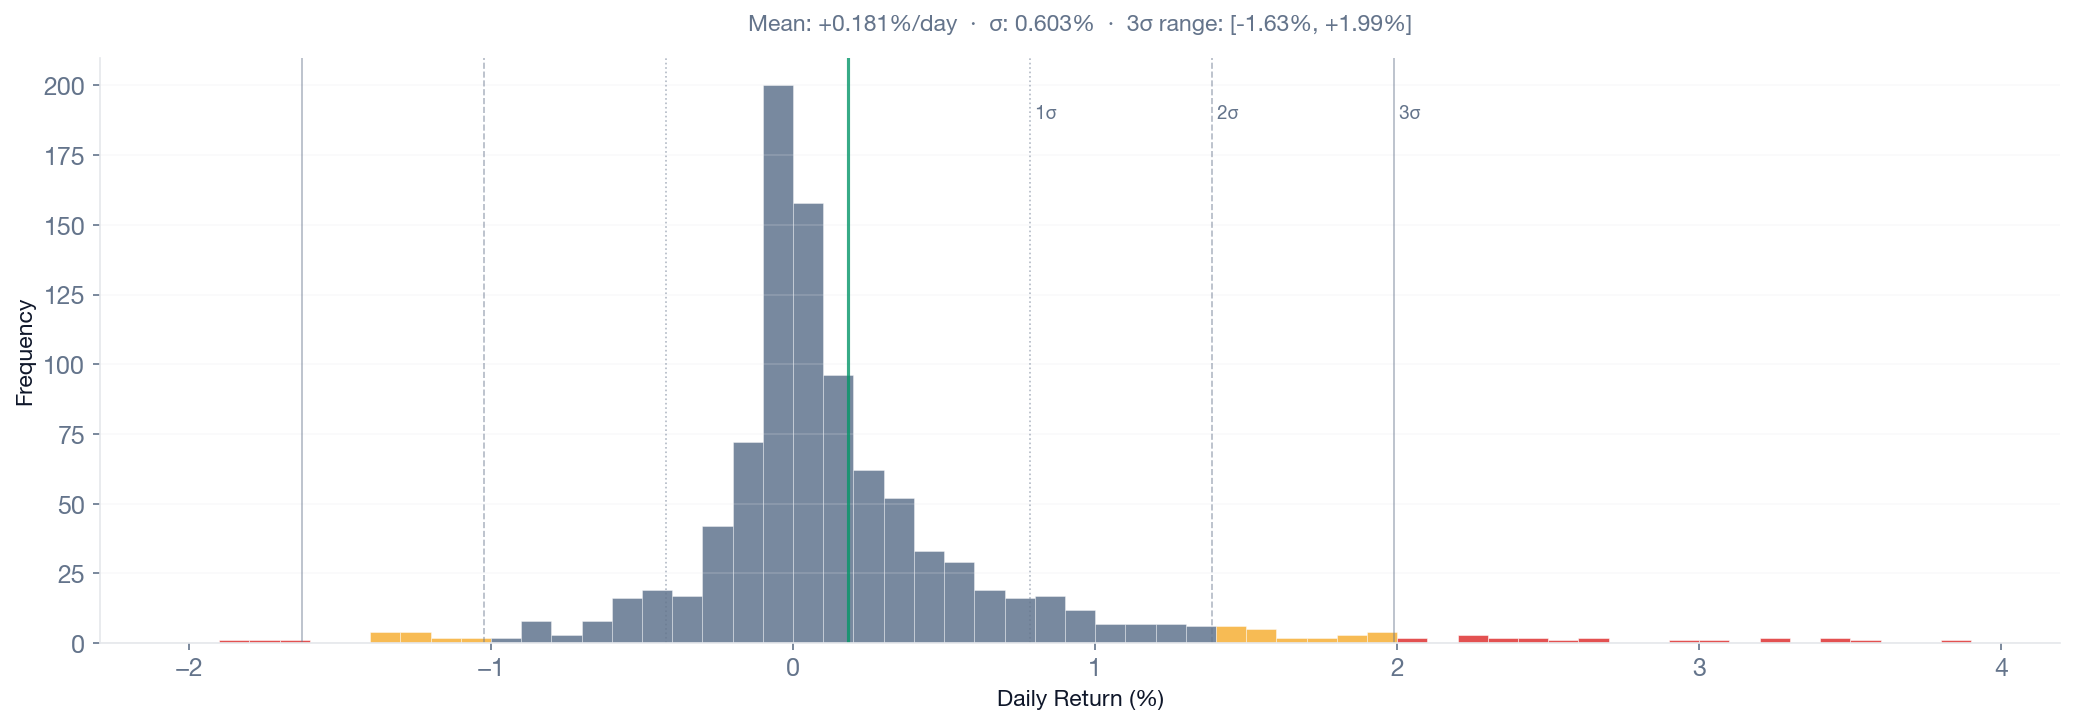
+0.18%
Mean Daily Return
[-1.63%, +1.99%]
3σ Range
The daily return distribution shows a tight, well-behaved profile centered at +0.18% per day. The 3σ range of [-1.63%, +1.99%] demonstrates controlled tails — extreme moves are rare and bounded.
This stability is the direct result of genuine multi-strategy diversification. When individual strategies experience drawdowns, others compensate, producing a portfolio-level return stream that is remarkably consistent.
Start the Conversation
Interested in learning more? We'd love to hear from you.